待完成

本文简单概述Matplotlib绘图库三个主要的类

  • Axes
  • Figure
  • Artist

通过以上三个类来了解作图的逻辑。推荐学习官网的示例

Axes

首先介绍Axes,他可以理解为坐标系,他的子类是aixs坐标轴(见名知意很好理解)。一下我们通过一个示例理解

1
2
3
4
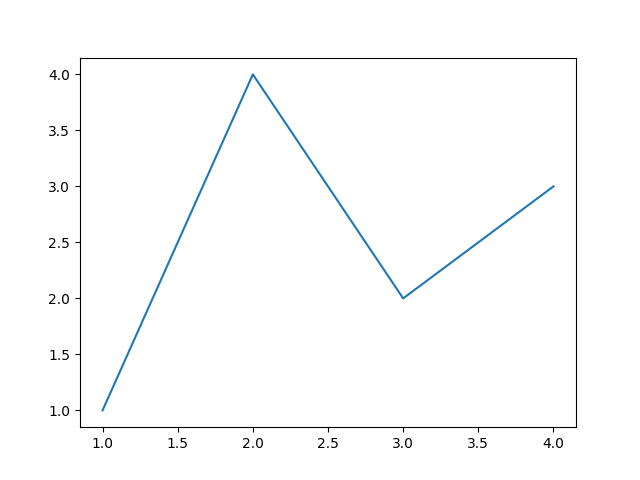
import matplotlib.pyplot as plt

fig, axs = plt.subplots()
axs.plot([1, 2, 3, 4], [1, 4, 2, 3])

以上我们引入matplotlib中的pyplot别名为plt

通过调用plt.subplots() 返回两个对象 fig( figure),axs( axes)。

Axis

Axis顾名思义数轴,可以定义刻度,单位等

Figure

整体画布

Artist

图画元素, 线条的形状等

面向对象语法

axes

1
2
3
plt.subplot() 	# 初始化一个axes

plt.subplots(m, n) # m行n列axes
1
2
3
4
5
6
7
fig , axes = plt.subplots(2,1, figsize=(6,6))  # 两行一列,

axes[0].bar(sm1, sm2) # 柱状图

axes[1].plot(sm1, sm2) # 折线图

plt.show()
1
2
3
4
5
fig , axes = plt.subplots(2,2, figsize=(6,6))

axes[0, 0]

axes[0, 1] # 以坐标调用

Figure

plt.figure()返回一个画布

可以设定很多参数

1
2
3
4
5
6
7
8
9
10
def figure(num=None,  # autoincrement if None, else integer from 1-N
figsize=None, # defaults to rc figure.figsize #多少英寸
dpi=None, # defaults to rc figure.dpi #清晰度
facecolor=None, # defaults to rc figure.facecolor #背景色
edgecolor=None, # defaults to rc figure.edgecolor # 边缘色
frameon=True,
FigureClass=Figure,
clear=False,
**kwargs
):

全局参数

1
2
3
4
5
6
7
8
9
mpl.rcParams['font.family'] = ['Heiti SC'] # 字体

mpl.rcParams['figure.dpi'] = 300 # 清晰度

mpl.rcParams.get('figure.figsize') # 获得画布尺寸

para = {'figure.dpi': 500, 'figure.figsize': [10, 10]}

mpl.rcParams.update(para) # 通过上面的参数进行一次更新